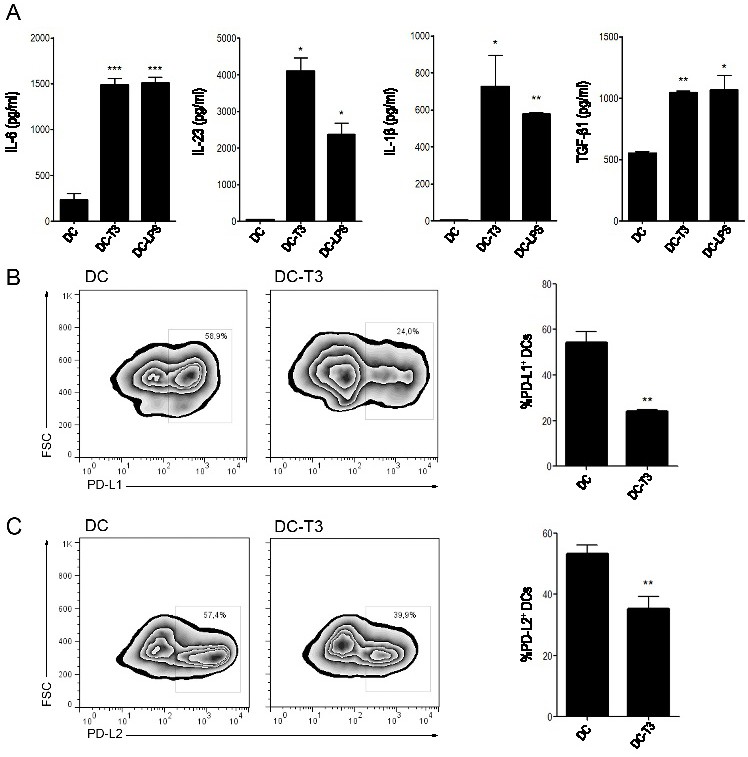
Fig. 1. Cytokine profile and PD-L1, PD-L2 expression of T3-stimulated DCs. DCs were stimulated with T3 (5 nM, DC-T3) or LPS (100 ng/ml, positive control [16], DC-LPS) for 18 h, or left untreated (DC). (A) IL-6, IL-23, IL-1β and TGF-β1 production was determined in culture supernatants by ELISA. (B, C) Expression of the co-inhibitory molecules PD-L1 and PD-L2 were determined by flow cytometry. Representative density plots of PD-L1 and PD-L2 expression (left B and C, respectively) were gated on CD11c+ cells. Comparative analysis of the frequency of PD-L1 and PD-L2-expressing DCs (right B and C, respectively). Data are expressed as mean ± SD from a representative experiment of 3 with similar results performed in triplicate. *p<0.05, **p<0.01, ***p<0.001 vs. control DC.